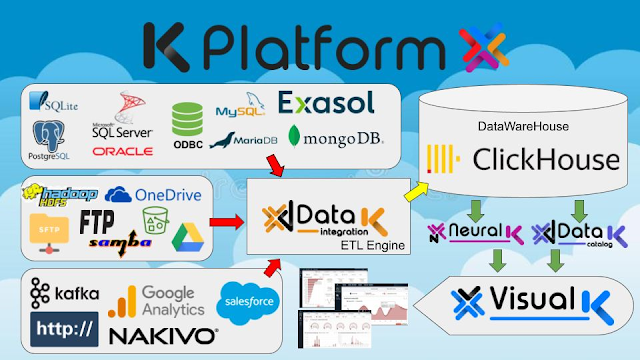
Kplatform a toolset for ETL, BI, AI
K-Platform is a professional tool developed by DataLife which allows BI-Specialist, Data Scientist, Data Managers to create ETL tasks and flows, create and manage dashboards for Business intelligence, trains and apply AI models.
It is structured in 4 main modules:
• Data visualization
• Data integration
• Data Catalog
• Artificial Intelligence
There are 3 different roles:
- Administrator: can do everything
- Editor: can create dashboards and ETL projects
- User: all in read-only mode
Administration
The Administration module is an area where you can configure things that are valid across the platform (Users, SMTP, Apps…).
In this module, the administrator can create "Applications", which are a kind of containers for
pages.
In each page you can include "Subpages" or "Modules"
Each module is a container for widgets like bars, pie, lines, histograms, data grids, etc.In each application, it is important to define the "Resources", which are
basically database connections that are used to retrieve the data and complete the panels.
Users and Apps
To create a new User, you must be an administrator and navigate in the Administration area of the hub
in the "Users" section
To create a new application, you need to create a new database in which all the information will be stored.
information about your panels, connections and everything necessary for that application to work.
From the Administration area it is also possible to fully customize the interface of the platform
changing its logo, colors and the complete Style Sheets
The data visualization module is divided into applications that are displayed as aligned cards on the
first page.
Each application has its pages, subpages and panels.
Each page can be edited by clicking the pen icon at the top right. When are you going to
Adding a module requires choosing which type of widget to use.
Each module on the page can be added by dragging and the left stick icon to the right stage.
The pen icon at the top right of each module allows the editor to configure the widget.
Most widgets require a connection, to choose "dimensions" and "measurements" by choosing one or more
fields from the linked database table.
Dimensions are typically fields like "time/date," "countries," or any repeating series of data.
The measures are the object of the aggregation operation that is performed on the data (sum, average, min.,
max, count, etc.) as these are usually numbers like quantities, integers, or floats in general.
The data integration module allows the platform to function as an ETL engine.
It uses Apache Airflow under the hood to schedule and run various types of tasks.
In the module it is possible to create different projects that are a kind of logical separation for the
operations.
Within each project it is possible to define 3 different types of resources.
- Database
- File system
- Services.
A database resource is a connection to a remote or local database where the engine operates to
store or retrieve data.
The supported databases are:
- PostgreSQL
- MariaDB or MySQL
- Oracle
- MS SQL Server
- SQLite
- Exasol
- IBMDB2
- ClickHouse
- MongoDB
- and a generic ODBC driver
Supported file system drivers are:
- Local
- FTP
- SFTP
- HDFS
- S3
- Samba
- OneDrive
- Google Drive
Services are external resources that you can access, such as an HTTP resource, KAFKA, SalesForce,
Google Analytics and more.
Tasks
Once the connections are created, it is possible to create a "Task".
A task is a single operation that typically uses one or more connections/resources/services.
There are different types of tasks:
- File Utilities:
Allows you to copy, move, delete, find, read, and write files on two file system resources different. - Archive files:
It allows to compress/decompress files like .zip, .gz, .tar.gz, etc. - Http and HttpToFile:
Allows sending http request with data using all http verbs like GET, POST, PUT, DELETE etc. - Database to database:
Allows you to transfer data from one database resource to another by mapping the data and creating the DDL based on the result of the query. - File to database:
Allows you to transfer data from a file (csv) to a database resource. - Database to file:
Allow exporting data from a database to a flat file. - SQL task:
Allows one or more arbitrary queries to be executed against a database resource. - Python task:
Allow to execute a python script that can be a multipurpose task - Bash:
Allow running a bash script that can also be a multipurpose task - Email:
Allow to send an email
Flows
One or more tasks can be executed within a flow.
A flow can orchestrate many tasks, running them in parallel or sequentially, it can be scheduled
to run at a specific date/time.
New and more complex tasks are coming with the new version, including conditional operators,
the for-loop operator and many others.
To add a task to a flow, simply drag and drop the task onto the stage and connect to the
start using the arrows.
In this way, it is possible to create complex sets of tasks that can execute different types of
operations.
Data Explorer
Another useful tool included in the data integration module is the Data Explorer.
Allows you to explore Databases and File Systems.
The Database Explorer allows you to visually create queries from a table that includes
conditions and joins to other tables.
The FileSystem Explorer allows you to browse a file system resource by performing operations
Basics in files and directories such as upload, download, copy, rename, delete, edit and more...
For more Information feel free to contact me or visit my personal website.


No comments:
Post a Comment